DEFINITIONS
What is Risk Analysis for?
Risk analysis of a financial portfolio is the process of identifying, assessing and controlling threats to an investment portfolio.
What is Return Analysis for?
Return analysis is the calculation of expected profits and losses of an assets' portfolio. Different methodologies allow to estimate the fair value of single assets, to calculate the correct mark to market value of the portfolio and to determine the expected returns of the investments.
Do markets always grow in the long run?
Generating positive returns during periods of favorable market conditions is generally less challenging than preserving capital during adverse market phases. While developed equity markets—particularly those in the United States—have historically delivered positive long-term performance, investments in equity instruments are subject to significant short- and medium-term volatility, with no assurance of positive returns over any specific investment period.
Furthermore, certain investors are subject to regulatory, statutory, or internal policy constraints that limit investment activities primarily to fixed income instruments. Such constraints require the simultaneous management of interest rate risk, credit risk, and foreign exchange risk, while aiming to achieve real returns in excess of inflation. In this context, even limited misallocation or mispricing may materially affect overall portfolio performance.
How do we create value in portfolio analysis?
Calculating the expected returns, not only observing only happened in the past, and analyzing risks properly are the only two relevant elements in a capital allocation process
What portfolio managers usually do?
Portfolio managers typically employ quantitative and statistical optimization methodologies to determine asset allocation strategies, often simulating a large number of portfolio combinations in an effort to optimize the risk–return profile. In these models, risk is commonly measured as the historical volatility of returns, while expected returns are derived from historical performance data. These approaches rely on historical observations and, as such, do not provide any assurance that future results will replicate past performance.

Portfolio Enhancement
The data points are coloured according to their respective Sharpe ratios, with blue signifying a higher value, and red a lower value. The red star represents the portfolio with the highest Sharpe ratio, while the green star denotes the minimum variance portfolio.
How do we identify the best asset allocation?
Accordingly, a rigorous and instrument-level assessment of expected returns is essential. For fixed income instruments, this involves the determination of "fair values" through the analysis of yield curves, credit spreads, and derivative pricing models. For equity instruments, valuation is based on fundamental analysis to estimate intrinsic value, supplemented by technical indicators and the assessment of market-relevant information to support timing considerations.
Recent advancements in neural network-based models have enhanced forecasting and analytical capabilities. Nevertheless, all investment strategies are subject to comprehensive backtesting prior to implementation in live market conditions, with the objective of evaluating performance across multiple scenarios and increasing the robustness and consistency of outcomes.

Forecast Model with Recurrent Neural Network in Python
How to manage correctly risks?
A comprehensive understanding of the risks associated with a portfolio is essential in order to accurately assess potential outcomes under adverse market conditions. As historical data are not indicative of future performance, such understanding can be achieved only through forward-looking analytical techniques, including sensitivity analysis. Sensitivity analysis examines how uncertainty in the output of a quantitative model or system can be attributed to, and decomposed across, various sources of uncertainty in its input parameters. Within financial markets, sensitivity analysis is used to evaluate the impact of changes in key input variables on selected target metrics, thereby enhancing risk awareness and decision-making robustness.
Our Business Proposal
The Company’s proposal is to support the oversight of clients’ investment decisions by providing timely notifications in the event that portfolio positions or investment actions deviate from predefined investment guidelines, risk parameters, or return objectives. The pricing and position-keeping system is designed to integrate with the client’s existing infrastructure and to monitor investment activity automatically at a predetermined frequency, generating alerts where relevant thresholds are breached.
Depending on the scope of the selected service, the system may also issue predictive alerts where there is a statistically significant probability of adverse market or portfolio events. In addition, and upon request, the Company provides periodic reporting that is fully aligned with the applicable requirements and standards established by European supervisory authorities.
Why we are different?
Sophisticated pricing, hedging, forecasting and risk analysis models are often useless if the calculation is done by people who do not constantly follow financial markets. All our models are adopted and tested by traders and portfolio managers for portfolio managers.
examples of reports
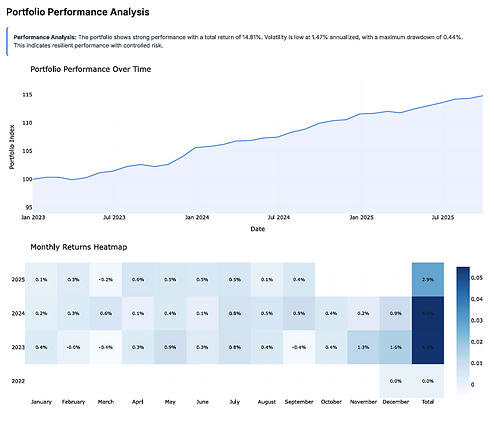
Portfolio Analysis


Liquidity Stress testing and Sentiment Analysis


Cashflows calculation and YTM comparison with Swap Curves


Volatility and Return Distribution

VaR BackTesting

Real Time Limit Monitor for Ucits Funds or Proprietary Books

Limit Monitor for hundreds of Managed Accounts

... with automatic generation of suggestions

Powered by Python
Bond Portfolio build by code developed and improved by Artificial Intelligence
Portfolio simulation in python


portfolio analysis in our app


